Who gets what in a shortage?
In America, we aren't accustomed to hearing much about shortages. But starting in 2020, we all began to hear a lot about them. First, there were toilet paper shortages. Then there were mask and PPE shortages. With many adjusting to staying at home, purchases of imported durable goods surged, and we heard a lot about supply chain bottlenecks, including the large container ship that blocked the Suez Canal, a major global shipping route, for six days in March 2021. Later in 2021, when the lock-downs had passed and economic activity began to re-normalize, we had global petroleum shortages as petroleum exactors, with significant coordination through OPEC+, showed reticence to bring oil wells back online. Early in 2022, Russia's invasion of Ukraine had a major impact on global wheat production, as Ukraine was a major producer, and the sanctions on Russia effectively cut off a major supplier of petroleum to much of the world and of fossil gas especially to Europe. Here in Texas where I live, there was a brief electricity shortage for a few days in February of 2021 that resulted in long rolling blackouts and cost some 200 people their lives.
All of this was a big shock to those of us living in the US, Europe, and other "Global North" countries where we're accustomed to getting the first pick of global supply, and letting the rest of the world compete over the remainder. In the rest of the world, shortages are much more common. This is, for example, why food riots happen: a poor people accustomed to eating at a subsistence level does not spontaneously get fed up one day and riot; food riots are typically in response to a sudden shortage of key food staples. Wheat shortages and the resulting price increases played a key role in the uprisings of the 2010s in the Middle East and North Africa, often collectively called the "Arab Spring", a connection I wasn't aware of until I encountered it in Rupert Russell's book Price Wars a few years ago.
This piece will not go into real-world detail to understand these specific shortages. Instead, I want to present a very, very simplified and stylized mental model for understanding how our societies deal—and how the world as a whole deals—with sudden shortages.
Much has been written about inequality within individual societies and globally. It's usually formulated as income inequality or wealth inequality, though we also increasingly hear about "carbon inequality", the idea that the consumption benefits associated with global emissions of heat-trapping gasses are distributed very unevenly. We hear this expressed in summaries such as "66.6 percent of the total wealth in the United States was owned by the top 10 percent of earners [while] the lowest 50 percent of earners only owned 2.6 percent of the total wealth" or "The richest 1% of people are responsible for as much carbon output as the poorest 66%".
This piece will not focus on this baseline inequality but rather takes it as given. I will focus instead on how we distribute the immediate real burden of a sudden and temporary shortage in the presence of significant preexisting inequality. I will highlight just the distributive aspect of a shortage, and not the many other important policy areas such as avoidance, preparedness, obtaining alternative supplies, and quickly restoring production. I will likely write about some of these other topics in future pieces, but there's plenty to explore about the distributional aspect of a shortage, and in this piece I'll be focusing on that.
Conceptualizing consumption distribution
Consider an abstract economy with a single consumption good—think food or energy. Everyone has some after-tax income, and they either use it to buy this consumption good or they save the income as cash. In this baseline, the people in the bottom 60% of the income distribution spend all their income and save none of it: the need for consumption is dire enough that the desire to save cannot compete with it, so people below that level are experiencing some amount of deprivation, but are mostly managing to survive.
Before I continue, I want to stress that no one should use a model this simple for the final draft of any real-world policy—it does matter that in the real world there is more than one good, for example! Still, the intuitions you can build from this simple mental model do provide a good starting point.
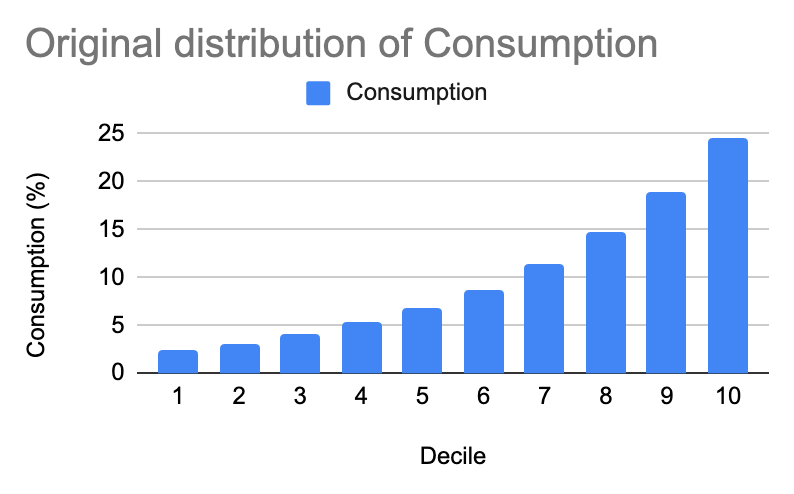
The graph above shows how personal consumption is distributed in this make-believe economy. In a perfectly even distribution of consumption, all of the bars would be the same height at 10%, so you can see here that this society, like most, has some significant consumption inequality: the bottom decile consumes about 2.5% of the total, and the top decile consumes about 25% of the total. You can see in the graph that the bottom 60% consumes less than average (10%), while the top 40% consumes more than average.
Note that income inequality in this example society is far greater than consumption inequality. That is because as described above (but not shown in graph), the bottom 60% spend all their income on consumption, whereas above that, people save a greater percentage of their income the richer they are. The mental model I'm presenting here focuses entirely on consumption, not income, because in a severe shortage, what matters most urgently is whether everyone's getting their food and heating to get through the period, not cash income per se.
Different possibilities for distributing a shortage
So what are some of the different mathematical possibilities for reducing total consumption by 20%? There are of course, infinitely many. To narrow it down a bit, I will focus on changes to consumption that do not alter the "pecking order", and do not increase anyone's consumption. Within this still-infinite class of possibilities, I will present a just a few simple examples.
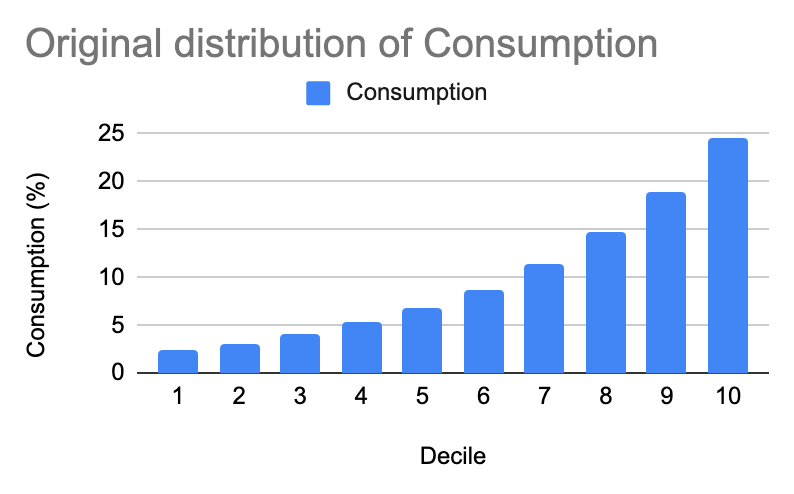

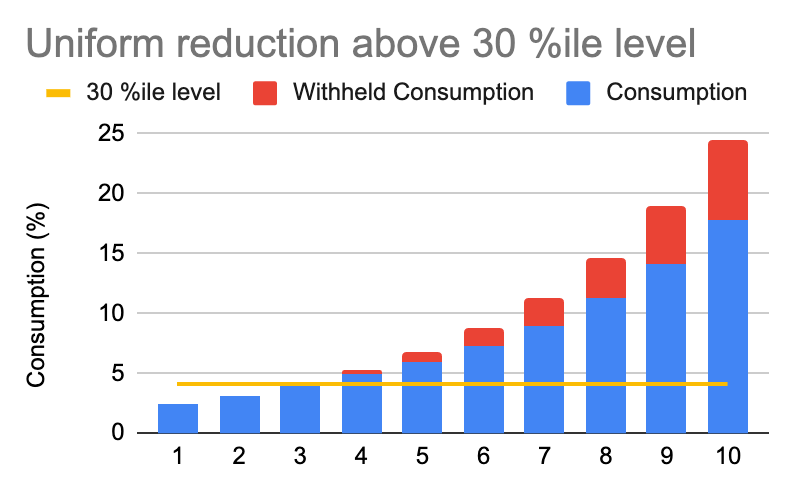
Original distribution of consumption (top left), and five different mathematical possibilities for a 20% aggregate reduction in consumption.
I will explore each of these examples and connect them to policies that might aim at each particular outcome.
Poorest-first reduction
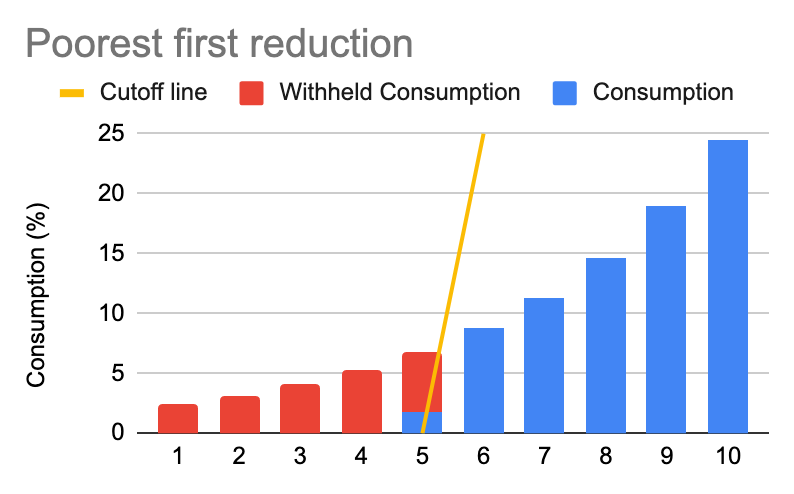
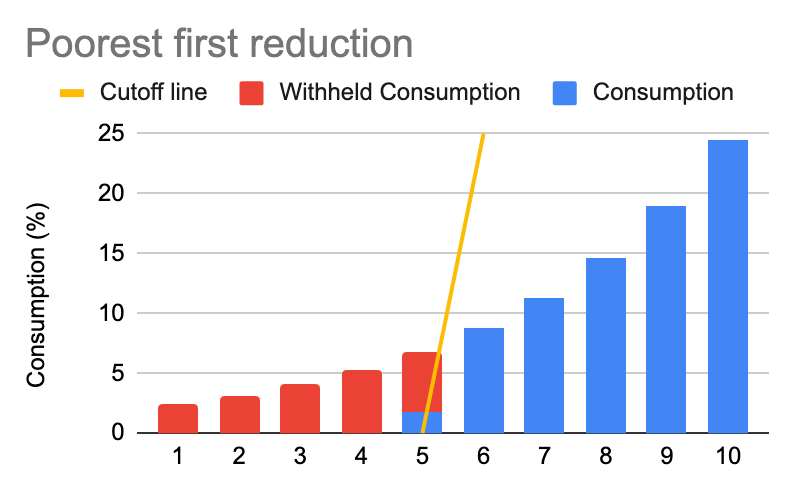
One mathematical possibility is to simply start with the poorest group first and reduce their consumption to 0%, then the second, and so on, until the consumption that remains is equal to 80%. This is shown below on the left.
For some goods—think food, energy for heating in the winter, or energy for cooling in a heat wave—this option would obviously be deadly. When I was going through the possibilities with my wife in preparation for this piece, when we came to this one, she said out loud, "Wait, why would we ever do this one?" I imagine this would be a common reaction. Yet, this is one of the main strategies that we use as a society, and indeed globally, to deal with fluctuations in output, including more severe shortages. This is the "rich don't notice, poor can't cope" strategy.
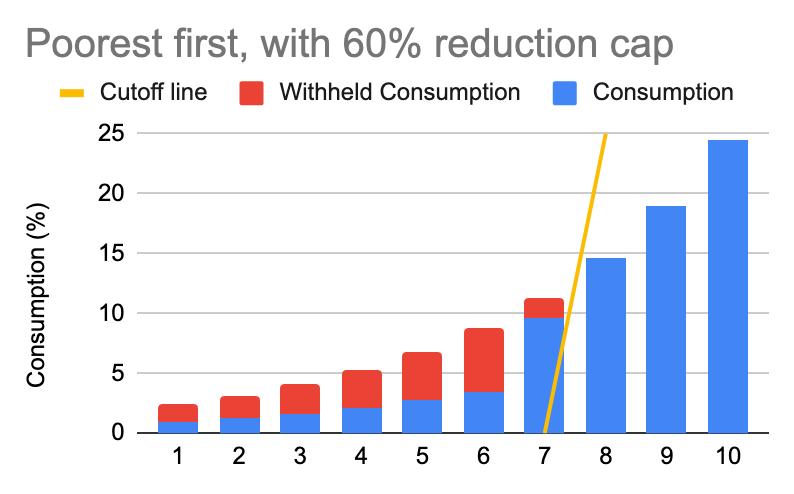
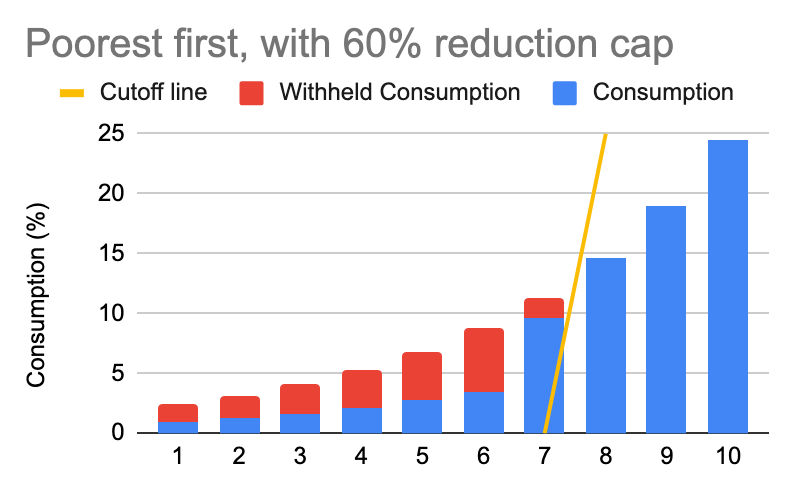
To understand what I mean, let us make this a little more realistic by capping the reduction to 60% of original consumption, but otherwise keeping the poorest-first reduction pattern in place. You can see this shown below on the right.
Policy example 1: The price system
This is more or less how the standard price system we're used to, with free floating prices determined by supply and demand, works in response to a shortage. It works by pricing out the poorest first, since they have no saving or savings[1] to dip into. In a severe crisis, prices that were previously stable can shoot up quite rapidly, because the rich can pay nearly any price, and the poor will spend everything they have not to reduce consumption. Only once enough of the poor are priced out does the price stop rising. Meanwhile, the rich may not even be aware that the price has changed ("I mean it's one banana, Michael, what could it cost, $10?").
Policy Example 2: Targeting Unemployment
Another entirely different policy that operates on this same poorest-first method of distributing lost consumption is that of targeting a particular positive rate of unemployment. Unemployment is the condition of seeking paid work but not finding any. As a matter of course, many individual people can be in this state for a few weeks or months as they're between jobs, sometimes called "frictional unemployment". At a macroeconomic level, however, there is always far more unemployment than this can account for.
It is somewhat like a game of musical chairs where there are 100 players and only 95 chairs: any individual can improve their game skills to have a higher chance of ending up in a chair, but there is nothing the group as a whole can do to prevent five people from ending up without a chair, because the outcome is predetermined by the game setup. In the real world, our governments target a particular rate of unemployment, sometimes called u-star after the variable (u*) that is used to represent it in neoclassical (which is to say, mainstream) economic models, and when unemployment is below target, it is typically the already least-advantaged workers who get laid off first.
The logic behind using positive unemployment as a policy tool is that if prices start to rise—a sign of a shortage—then by creating more unemployment, the government can deprive a small portion of households of any income beyond a meager level of government assistance, thus taking them out of the competition for consumption that is putting pressure on prices. As economic output fluctuates, you can imagine the yellow "Cutoff line" in the graph swinging left and right, putting just enough people into unemployment such that total consumption matches total available consumption goods, without affecting the price of the good or the consumption of the majority of people, who are not experiencing unemployment.
Of course, unemployment does not typically go up to 60% as implied in the chart above. In the US it is typically between 3% and 15%, so the yellow line is typically in the first or second decile. Besides the obvious negative effects for the people pushed into unemployment by this policy, it can also lead to a long term reduction in total production available for consumption, because the productive economy gets used to not providing the goods that the unemployed would have bought had they had the money. So this method can actually turn what would otherwise be a temporary shortage into a new status quo of reduced living standards.
Richest-first reduction
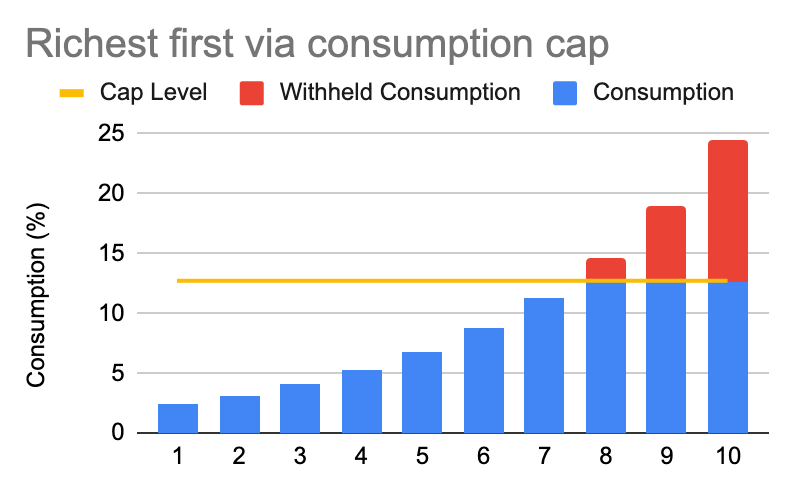
On the other end of the spectrum, one can make the numbers work by drawing a horizontal maximum consumption line to which all consumption is reduced, such that the amount reduced totals 20%. This is effectively a richest-first reduction, because this consumption cap clearly cannot affect anyone whose consumption is already below the line.
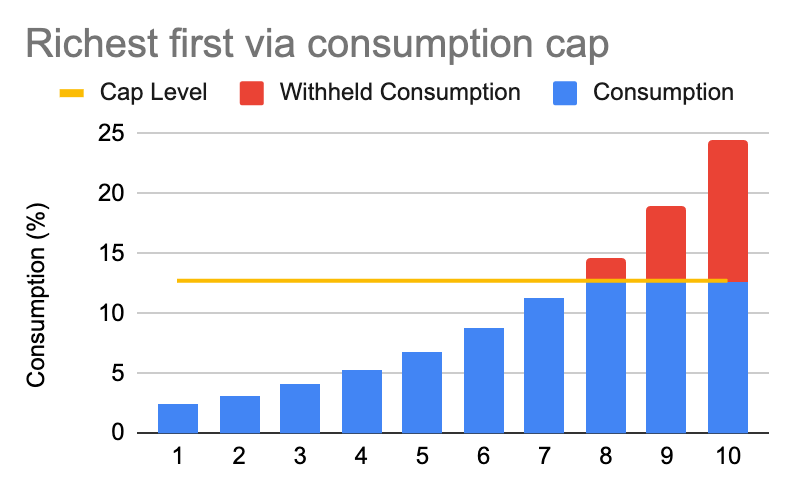
This method of distributing a shortage is more likely to appeal to those who view the original inequality as inherently unfair, or to those who view the original inequality as acceptable but who also believe that being on the top end of that distribution comes with a certain noblesse oblige that extends to making sacrifices in a crisis.
A policy that might achieve this distribution is a straightforward policy of quantity rationing, which is to say, simply making it illegal for any person to consume more than some maximum amount of the good during each period until the shortage is over. Whether such a policy is practicable will depend on whether the cap is easily enforceable, and whether the rich can in practice quickly reduce their consumption of the good without side effects that are themselves unacceptable. From the perspective of equality, this option compares favorably to the poorest-first method, so even if strict consumption caps are infeasible or unpalatable, it may still be worth considering whether there is a creative solution specific to the good in question that approximates this outcome without being as heavy handed. Emergency regulations temporarily banning normatively less important uses, such as the heating of outdoor pools during an energy shortage or watering of lawns during a drought, may have a similar distributive effect without the same potential negative consequences or may simply be more politically palatable.
Even reduction in consumption across the spectrum
Avoiding either extreme, another approach would be to reduce everyone's consumption evenly. Below on the left, you can see the simplest version of this, where everyone's reduction is reduced by 20%, regardless of their starting point. On the right, you can see a modified version where a baseline amount of consumption is protected and consumption above that is reduced by a uniform percentage, about a third. The two are similar, with the one on the left exactly preserving the preexisting amount of consumption inequality and the one on the right very slightly reducing consumption inequality.
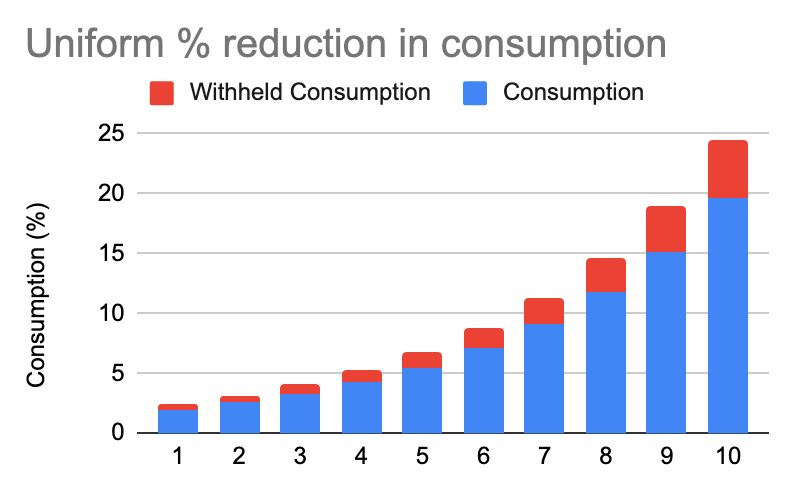
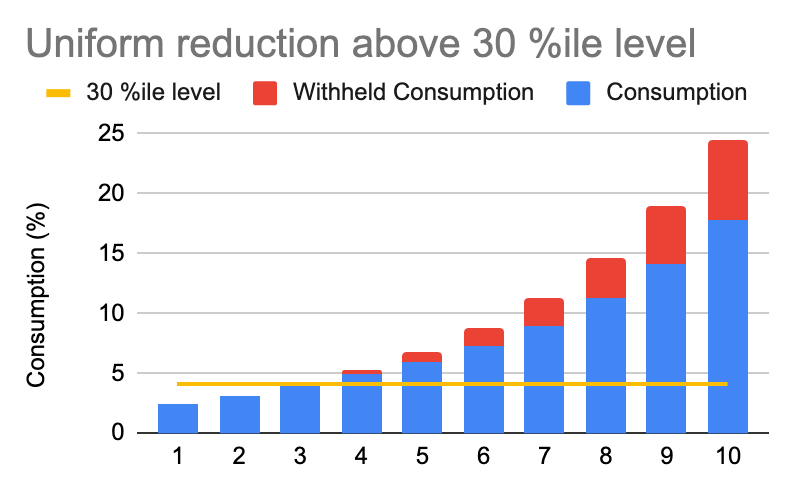
For people who feel that the preexisting level of equality was fair, or who for other reasons simply have a strong status quo preference, this outcome may seem more preferable than either the poorest-first reduction or the richest-first reduction.
It may be difficult to imagine exactly how one might design a policy to guide consumption towards this outcome, but one can actually find a recent example in German policy during the 2022-2023 fossil gas shortage related to Russia's invasion of Ukraine, using a policy they called an "energy price break". Since fossil gas distribution to households and industries was already a highly concentrated and regulated industry in Germany, they were able to implement a scheme in which the gas companies charged customers the pre-shortage price for up to 80% of historical usage and then market rate thereafter. The gas companies were reimbursed by the German government for the discounts. This design proved practicable and effective in achieving this rough distribution of voluntary consumption withholding. I'm sure that economists will be evaluating and debating this natural experiment in Germany for many years, but regardless, it is a truly interesting development.
The economist Isabella Weber played a large role in advising German policymakers in the development of this response, and I find her research on this and other topics very interesting. Her book on China's 20th century experience with price liberalization, How China Escaped Shock Therapy, is an incredible piece of historical economic research. She first came to wider public prominence when her short piece in the Guardian, Could strategic price controls help fight inflation?, was met with public vitriol by some prominent members of the economics community. Despite the push-back and outright derision she faced from colleagues, the economic debate within public policy circles came around to her approach much faster than most people could have imagined, once the human realities of the crisis in Europe became clearer. Her research focus on real-world strategies that countries including the US have used in the past to handle shortages and price spikes made her better positioned than most economists to advise policymakers during that crisis.
Conclusion
My goal in this piece was to outline a way of conceptualizing the effects of a shortage, and how they might look different under different policies. Which distribution you like will depend, among other things, on your values, and it was not my aim to advocate for a particular policy or target distribution. I did hope to highlight that the strategies we use today in practice are often precisely the ones that lead to the outcomes that most people are least likely to evaluate as fair, and to invite the reader to explore conceptually what doing better might look like.
There is far more to explore on the general topic of shortages, from how to prepare for them, to how to keep them as short as possible. I do not want to leave the impression that the distributional aspect that I focused on here is the only important issue related to shortages. Still, no matter how prepared a society is, no society is entirely immune to shortages, not even the US. As climate instability increases the frequency of disasters and crop failures, having a robust policy toolkit for getting through an acute shortage smoothly and fairly will only become more important. And that is something for which we are currently under-prepared, resulting in chaotic responses and potentially deadly results when shortages do happen, regionally and globally. For better policy, we might start by asking, for various goods, what distribution of consumption reduction best serves the public according to our values, and then design policy ahead of time with that in mind.
[1] The two concepts, saving and savings, are often confused with each other, but they are quite distinct. Saving is a precisely defined term that refers to the amount that is left over from income, in a particular period, after taxes are paid and consumption goods are bought. Savings is a less precisely defined term, but generally refers to the level of previously accumulated liquid financial assets, such as cash and checkable deposits, with the imprecision coming from what exactly counts as a liquid financial asset. Saving is expressed as currency units per time unit, whereas savings is expressed as simply an amount of currency units you have stored away at a point in time. A given person's saving in a time period does not necessarily result in an increase in their savings over the same time period; if they used their saving to pay down debt, for example, that would result instead in a reduction of their outstanding debt balance. Here I speak, somewhat informally, of saving and savings as two different sources a household could use to increase their consumption: they could either simply spend more of their income, or they could spend all of their income and spend some of their savings. They could of course also borrow to spend, but since the poor generally face low credit limits, this complicates the argument more than it adds to it.
If you enjoyed this piece, sign up for free. This is my second piece, so I'm still just getting started. Any comments or feedback you have is valuable, so let me know on Twitter at @dannydrob. I plan to write something about once every couple weeks to once a month.
